
Explainable AI based on Structures in Data
The explanations and reasons for decisions made by algorithms concerning the health and/or treatment options for patients are firmly demanded. This calls for systems that produce human-understandable knowledge and decision proposals out of the data such that domain experts can base their decision on these systems. There are different names for such systems: symbolic, knowledge-based, expert systems or recently “explainable AI” systems. Current explainable machine learning systems have either specific assumptions about the data or often do not follow the Grice's maxims, i.e., the explanations are not meaningful and relevant to domain expert [Thrun et al., 2021]. Using the already researched insights about structures in data and swarm intelligence, an explainable machine learning system (XAI), allowing for user interaction and understandable both upon the Grice’s maxims and from the perspective of domain experts is curently researched.

Decision Support Systems
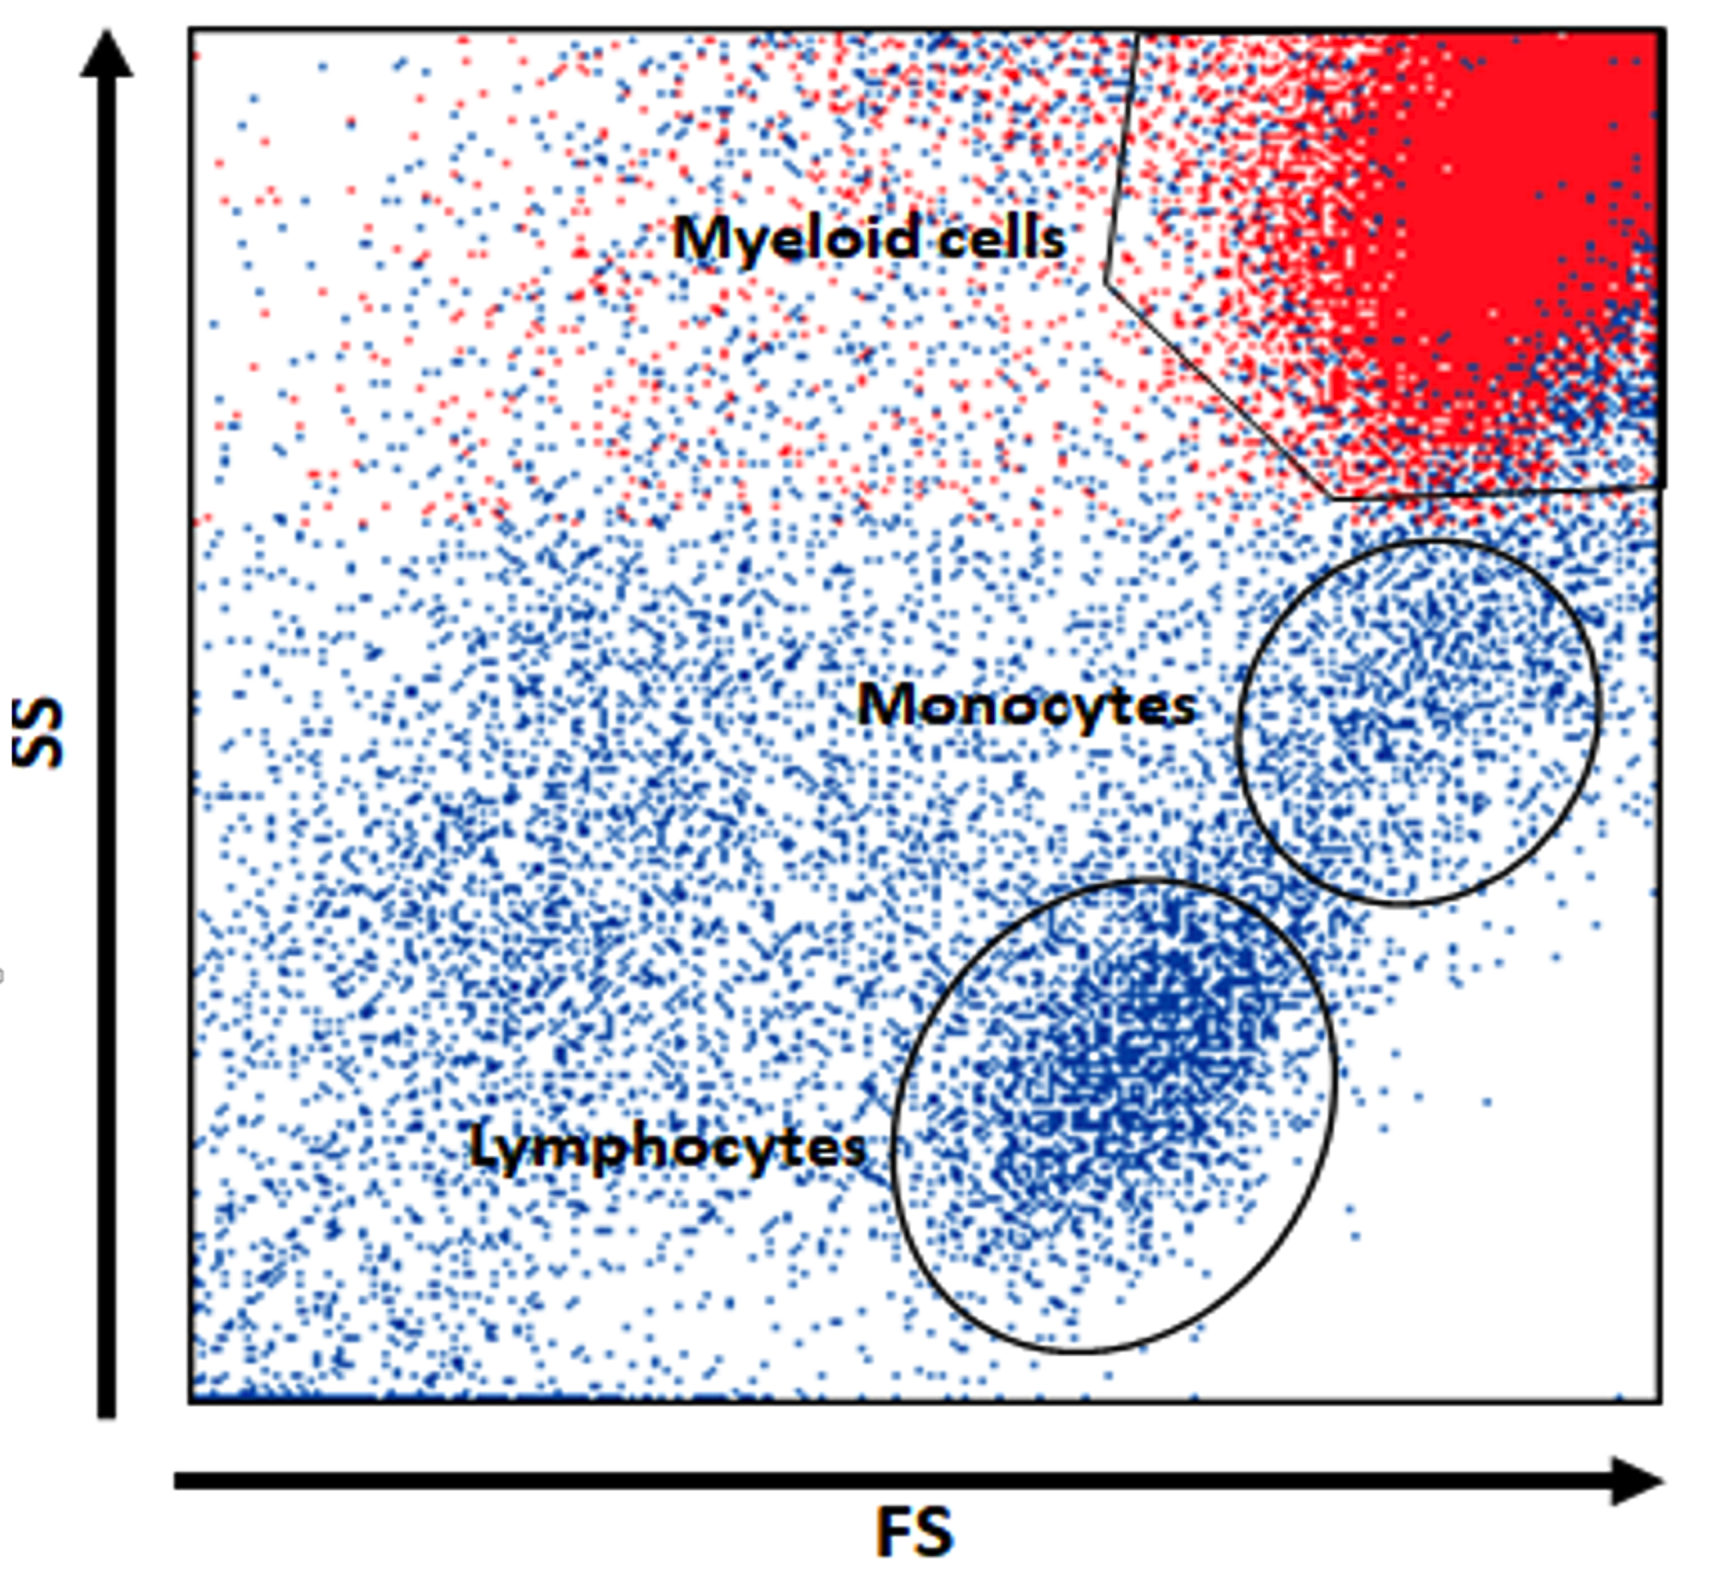
Several cutting-edge decision-support systems have been and are beeing researched and developed, significantly advancing both industrial and research practices. Each system addresses distinct challenges across medical, financial, and logistical fields. For example, Inflame.AI everages explainable AI (XAI) to diagnose inflammation causes, including bacterial and viral infections, using blood sample data. Employing the SMOTE technique for data augmentation, it achieves high accuracy and transparency. PLAIT, facilitates immune phenotyping of lymphomas via flow cytometry. It integrates Human-in-the-Loop methods with XAI, providing comprehensible diagnostics for complex cases and rapid second opinions through a browser-based platform. Another decision support system aids futures trading by analyzing diverse data sources for daily price forecasts. It adapts to market changes with daily model updates, reducing concept drift and enhancing traders' profitability. The forth The fourth system focuses on sales forecasting for on-demand delivery, offering precise demand predictions through interactive visualization and tailored modeling by product category, reducing supply chain costs. These systems showcase innovative applications of scientific methods in professional practice, yielding practical benefits like improved diagnostics, enhanced decision-making, and increased efficiency. The use of XAI and Human-in-the-Loop approaches builds trust and fosters user engagement. Two systems are cleared for publication and described below, while the others remain confidential due to non-disclosure agreements. Together, they highlight significant advancements in researching and applying scientific insights to solve real-world problems across diverse industries. Further systems are beeing currently researched.
Exploting Patterns in Data for Personalized Medicine
The next project is about the tumor grouping as a new modality of transcriptome-based personalized medicine. Algorithms of computational intelligence are applied to NGS gene expressions to obtain new knowledge from the totality of tumor genome data which goes beyond state-of-the-art targeted screening for mutations in tumor genes. Algorithms based on swarm intelligence will be used to process the high-dimensional data into group structures. In published preliminary projects, I have been able to show on microarray gene expression data that the method is in principle applicable to tumor biology datasets. The method will now be adapted for large NGS tumor transcriptome datasets. More accurate stratification (subgroup analysis) will be performed and correlated with known clinical and tumor genetic factors. The goal is to create a platform for data-driven classification of individual tumor transcriptomes into an optimal prognostic and diagnostic context.
Exemplary Finished Projects

Inlfame.AI Distinguishes between Pathogens of Inflammation
Inflammatory diseases are a leading cause of emergency visits and hospitalizations. Accurate and swift diagnosis is critical, as misdiagnosis and inappropriate treatments can harm patients. Despite this, empirical antibiotic treatments are often misapplied due to diagnostic challenges. Ou study investigated the use of AI-powered diagnostic tools to improve the identification and treatment of inflammation. The approach focuses on quick blood-based measurements, including myeloid activation, complete blood count (CBC), and C-reactive protein (CRP), combined with explainable AI (XAI) to distinguish between bacterial, viral, autoimmune, and control cases. Key findings reveal that leveraging synthetic data generation (SMOTE) and explainable decision trees significantly enhanced diagnostic accuracy. The AI system achieved a 90% overall accuracy, outperforming traditional machine learning models while providing comprehensible explanations for its decisions. This ensures compliance with legal requirements for transparent medical decisions. he study demonstrates that AI-driven diagnostic systems can accelerate and improve inflammation diagnosis, aiding clinicians in selecting the most effective treatments. Further research and data collection are needed to refine and prototype this promising decision-support tool. The research was presented to the press (see IDW.) and received positively (e.g. Tagesschau.)
PLAIT
The project is about the creation of a reference data analysis platform for immunophenotyping of B-cell non-Hodgkin lymphomas (B-NHL) using custom-fit artificial intelligence methods that justify their decision in such a way that a domain expert is able to review the decision. The goal is to automate usual simple cases (e.g., chronic lymphocytic leukemia) so that the domain expert can focus on complex cases. The group of B-NHL consists of various entities (diagnosis). The platform will aid the users in the classification of peripheral blood and bone marrow (BM) samples into different B-NHL entities. Due to the European legal situation, the suggested classification of a sample by the AI serves as a reference only and is provided with a human-understandable explanation after the physician gives an initial diagnosis. The project is called “Phenotyping Lymphomas with an Artificial Intelligence toolbox” (PLAIT). Some challenges are the proof-of-concept and building of a prototype that works on data from different cytometer units as well as data from other flow cytometer types (e.g., data standardization), and exploring the transferability on other panels, as well as the integration of another clinical center in PLAIT.
Interactive Display of Structures in Data
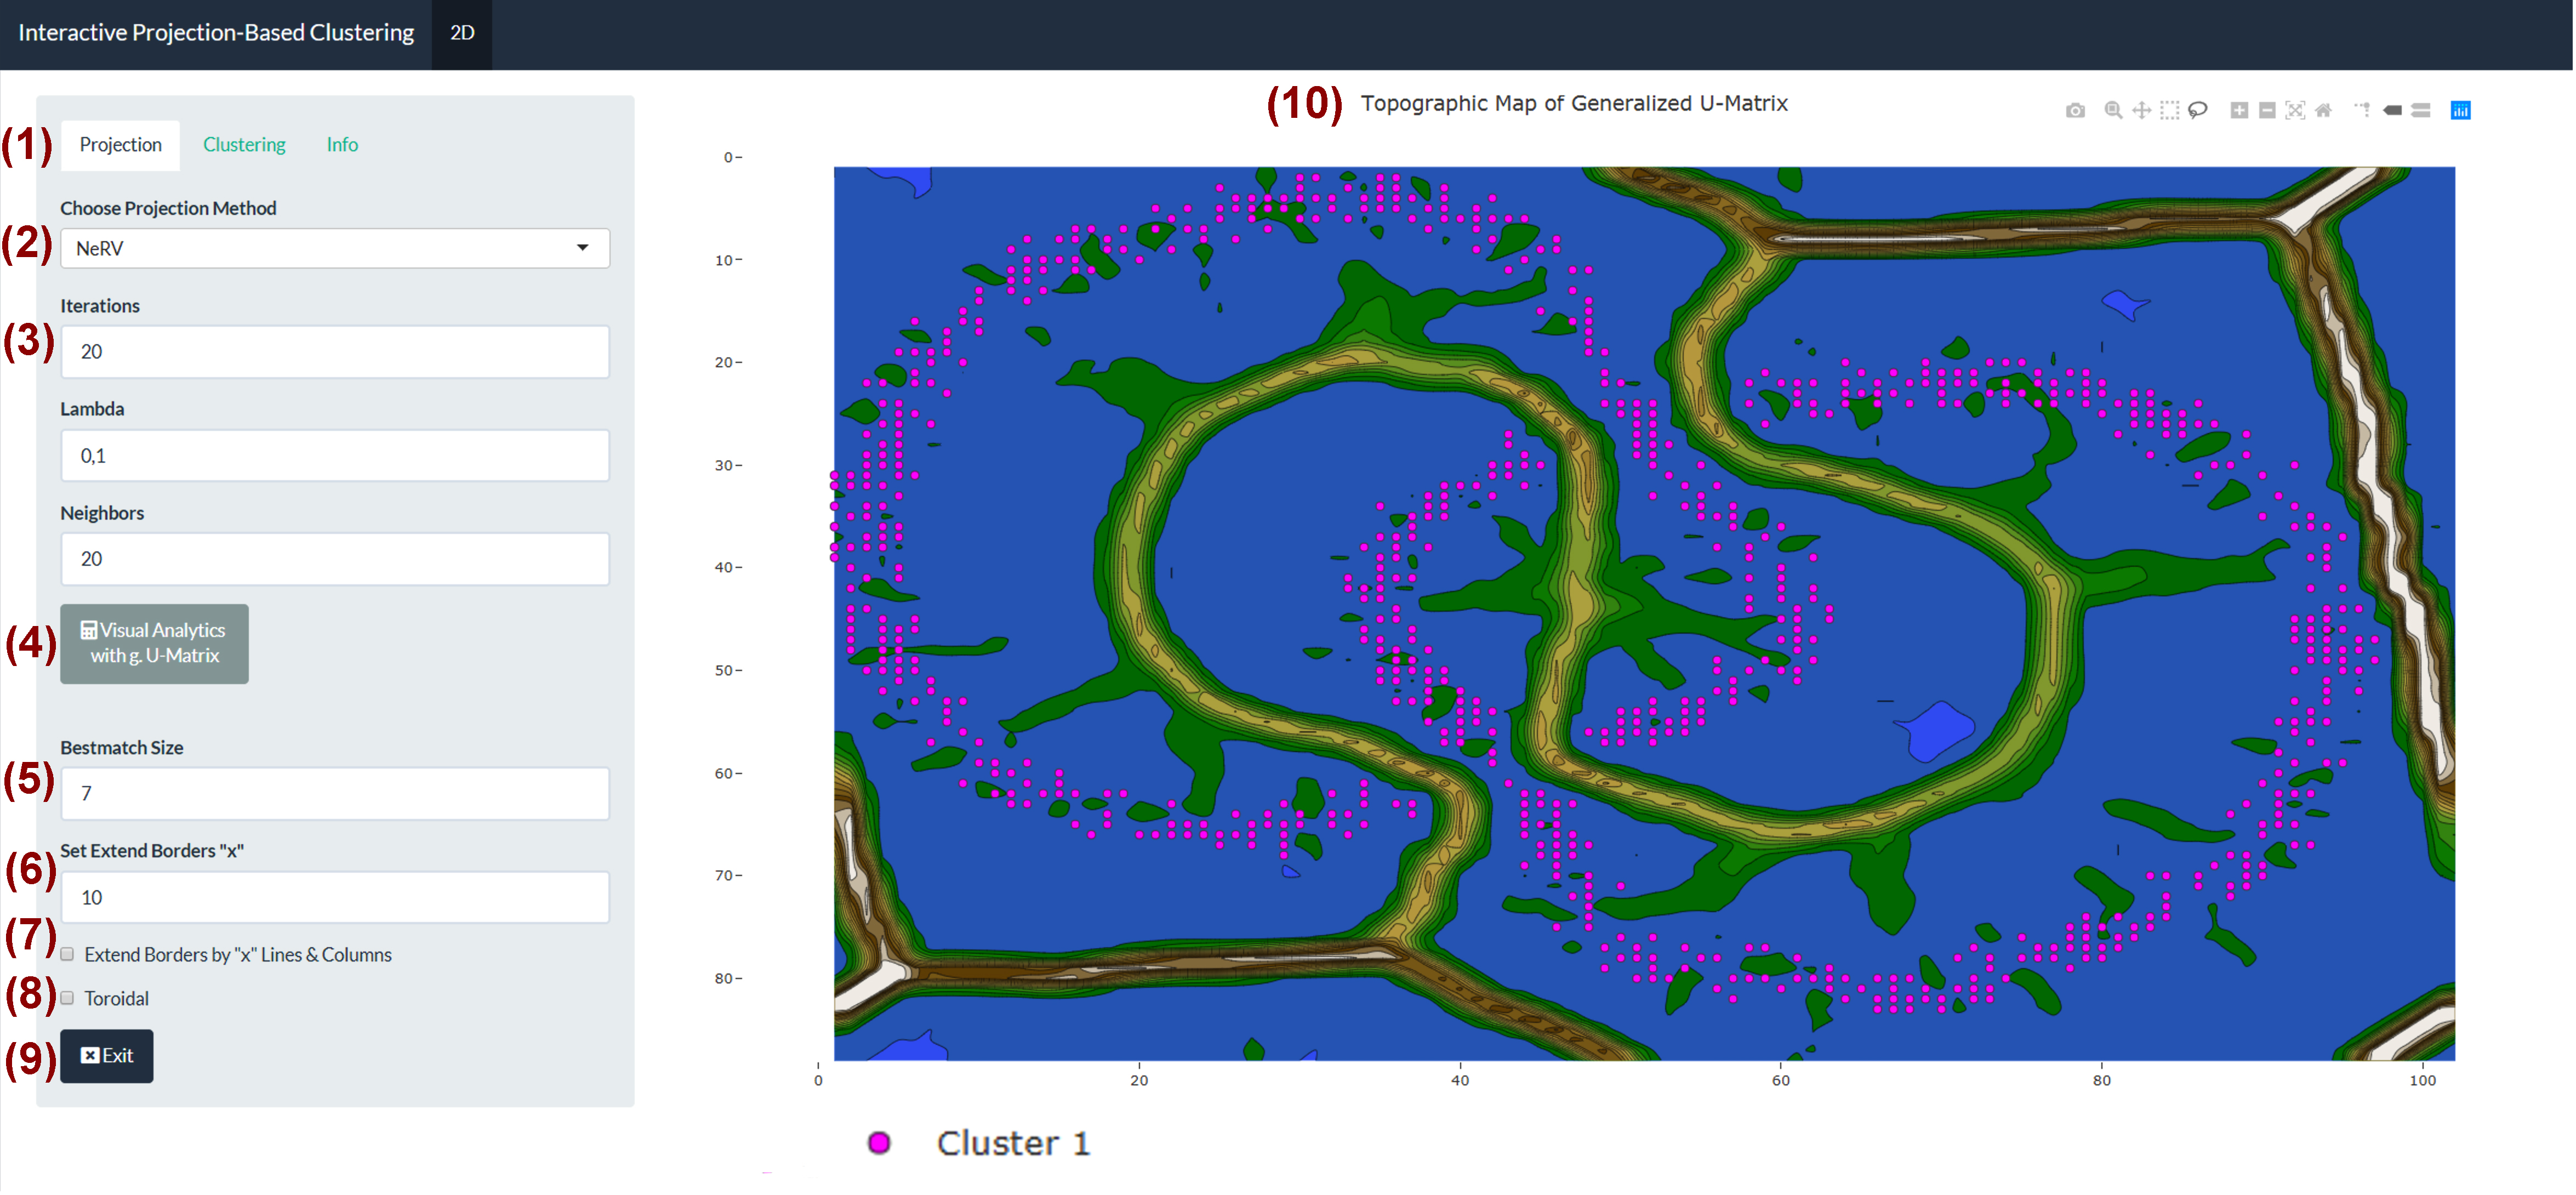
Clustering is an important task in knowledge discovery with the goal of finding groups of similar data points in a dataset. Currently, there are many different approaches to clustering, including methods to incorporate user decisions into the clustering process through various displays of structures in the data. Some of these interactive approaches fall into the category of visual analytics and emphasize the power of displays of structures in data to help find clusters interactively in various types of datasets or to verify the results of clustering algorithms. The interactive projection-based clustering (IPBC) is an open source and parameter-free tool using user input for an interactive display of structures in data in 2.5D and 3D based on the user’s choice of a projection method. IPBC uses cluster high-dimensional data either interactively or automatically.
Mirrored Density plot (MD plot)
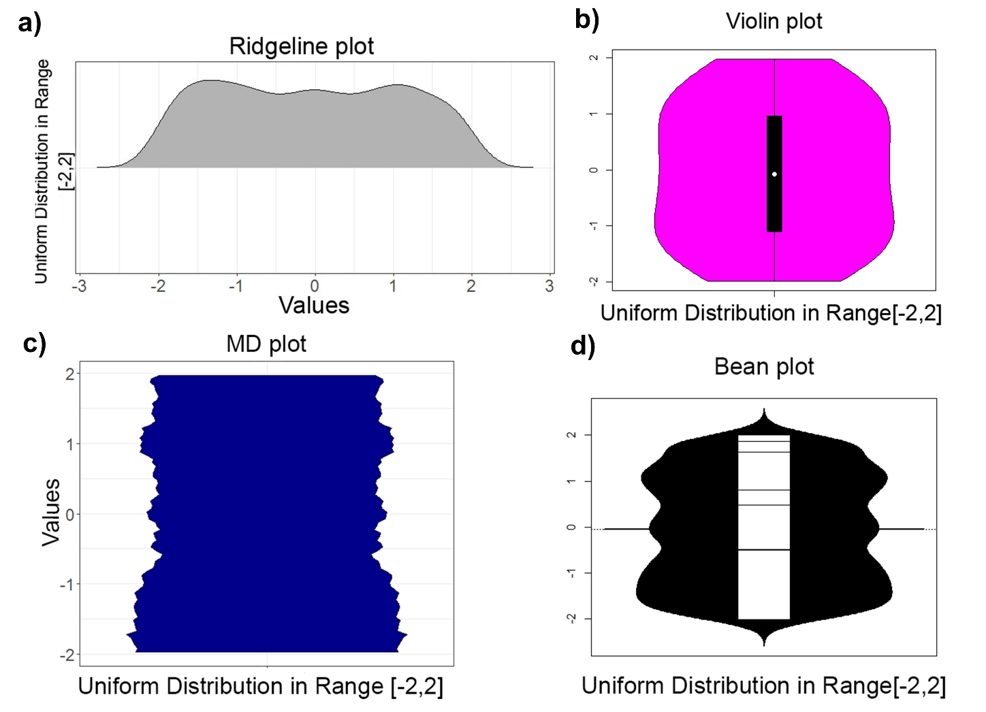
One aim of data mining is the identification of interesting structures in data. For better analytical results, the basic properties of an empirical distribution, such as skewness and eventual clipping, i.e. hard limits in value ranges, need to be assessed. Of particular interest is the question of whether the data originate from one process or contain subsets related to different states of the data producing process. Data visualization tools should deliver a clear picture of the univariate probability density distribution (PDF) for each feature. Visualization tools for PDFs typically use kernel density estimates and include both the classical histogram, as well as the modern tools like ridgeline plots, bean plots and violin plots. If density estimation parameters remain in a default setting, conventional methods pose several problems when visualizing the PDF of uniform, multimodal, skewed distributions and distributions with clipped data. For that reason, a new visualization tool called the mirrored density plot (MD plot), which is specifically designed to discover interesting structures in continuous features, is proposed. The MD plot does not require adjusting any parameters of density estimation which is what may make the use of this plot compelling particularly to non-experts.

Databionic Swarm
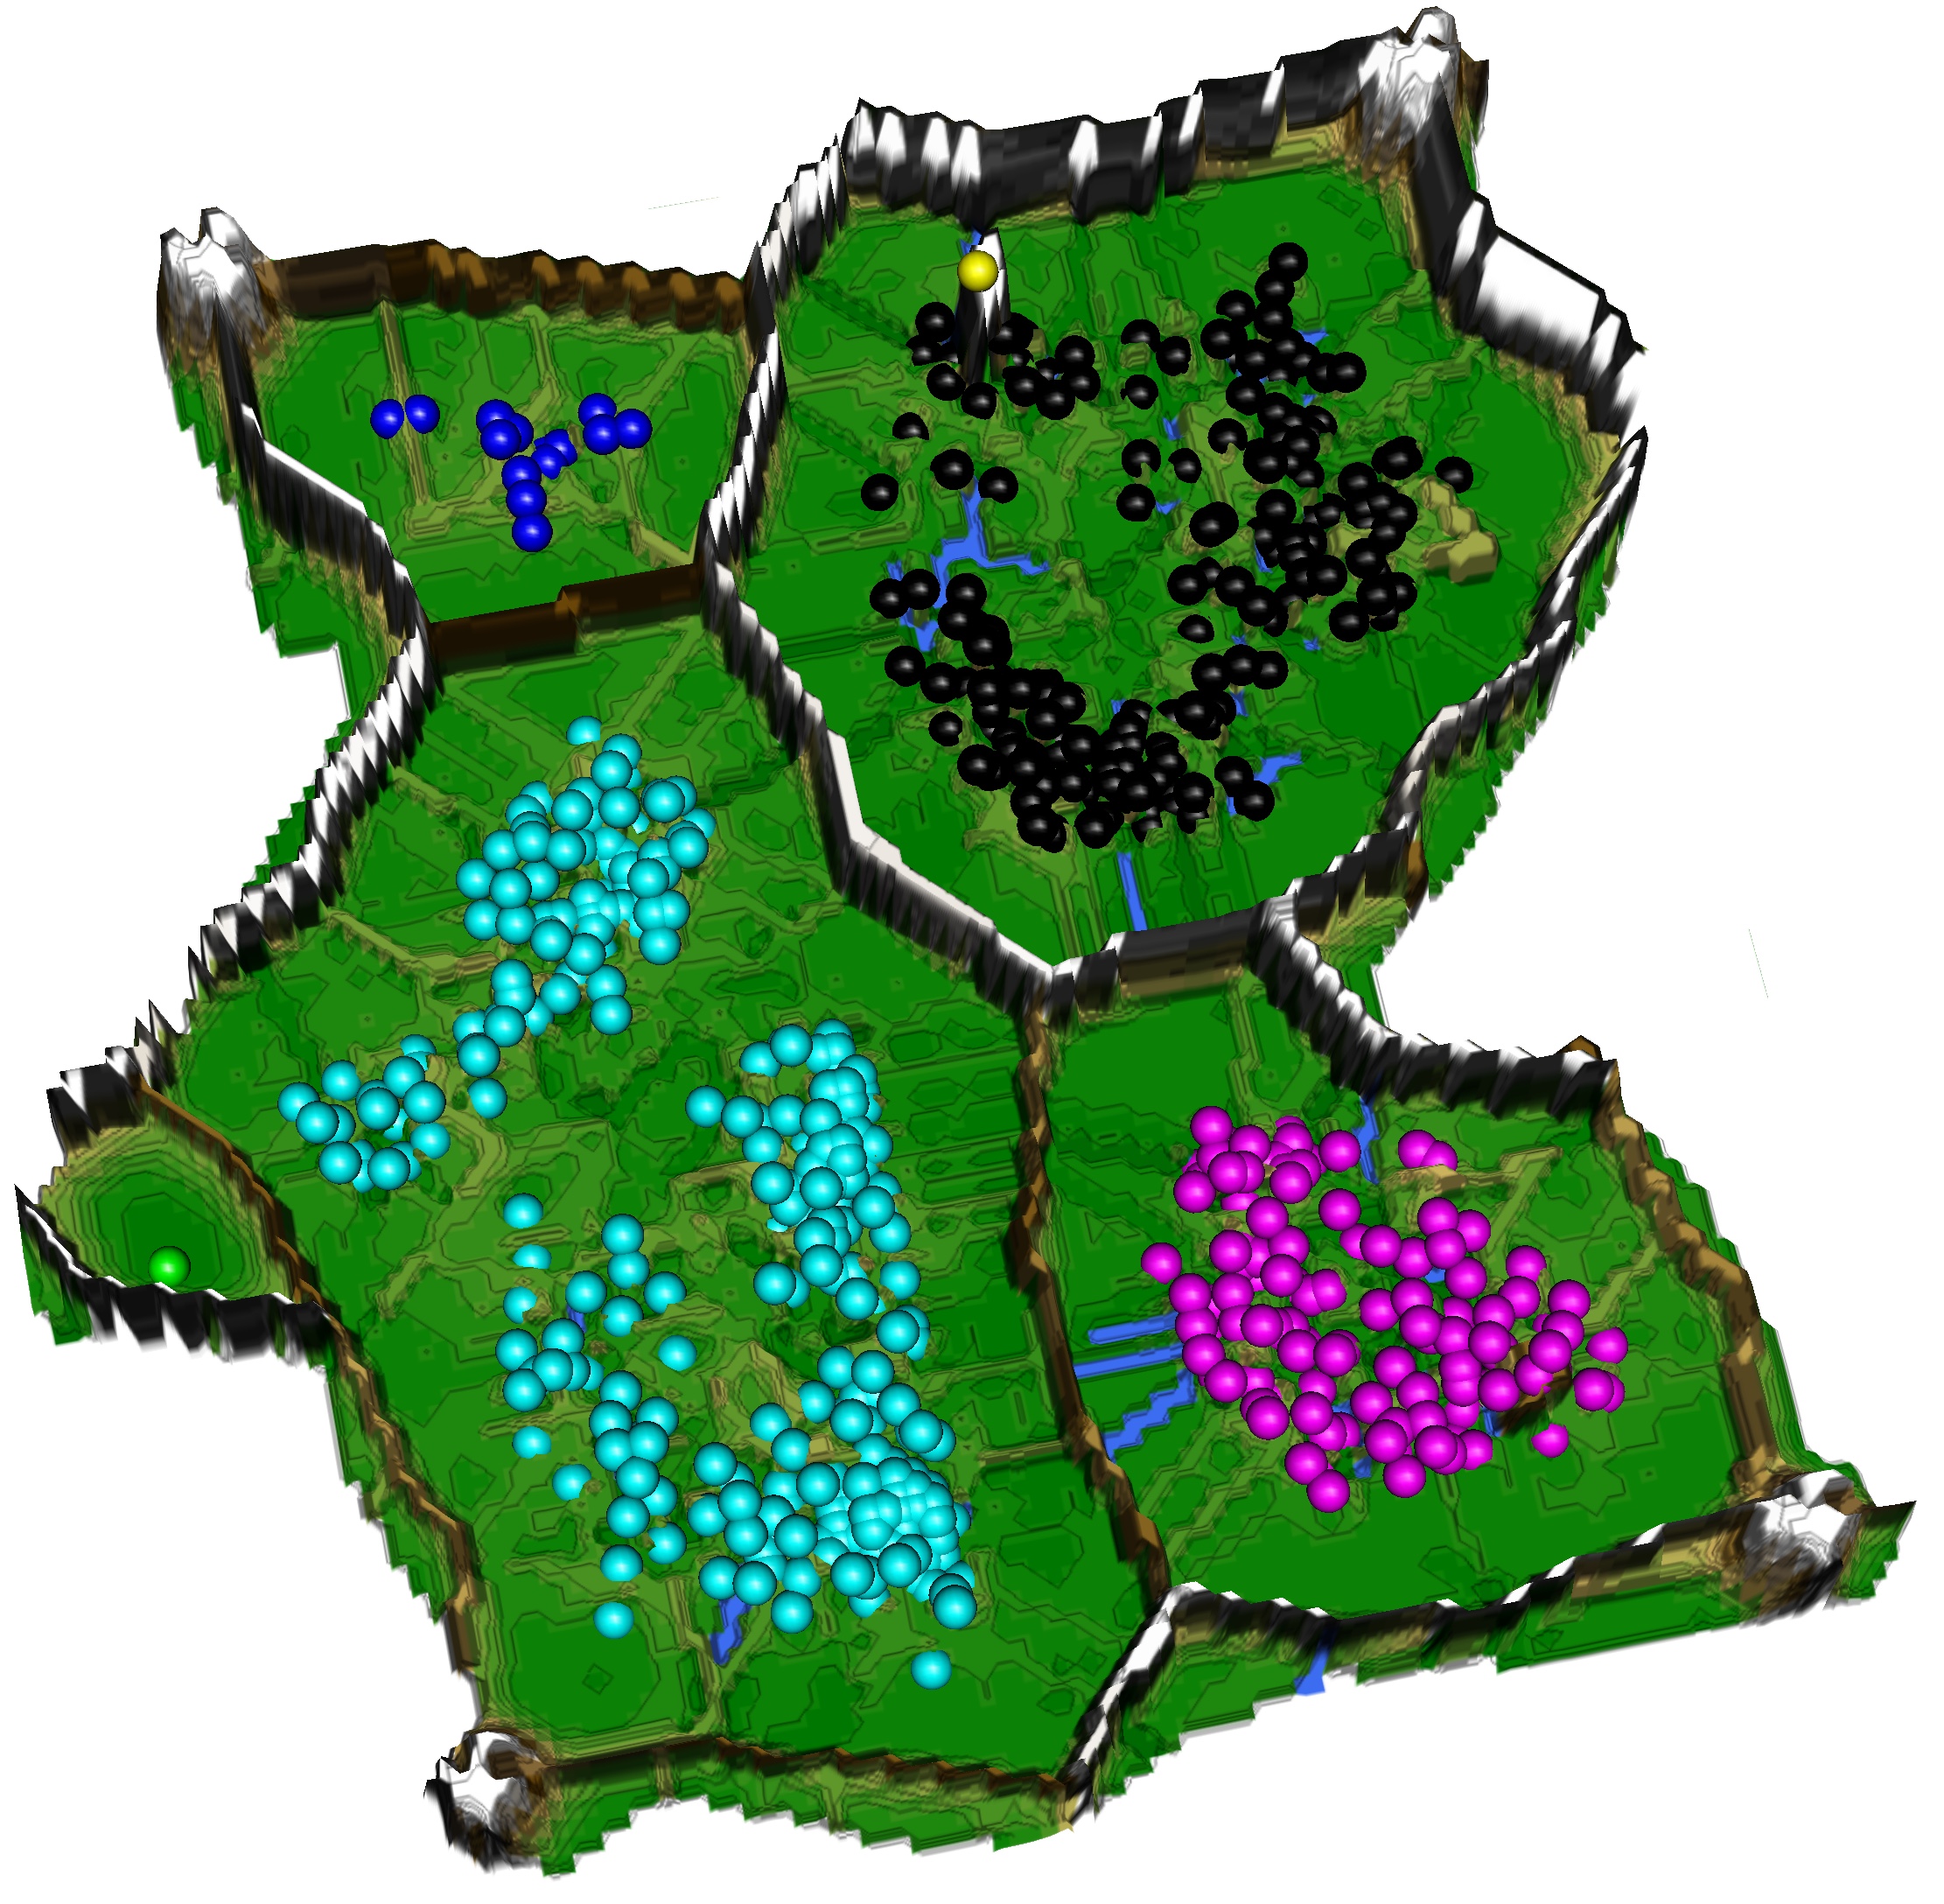
Algorithms implementing populations of agents which interact with one another and sense their environment may exhibit emergent behavior such as self-organization and swarm intelligence. In Thrun and Ultsch a swarm system, called Databionic swarm (DBS), is introduced which is able to adapt itself to structures of high-dimensional data characterized by distance and/or density-based structures in the data space. By exploiting the interrelations of swarm intelligence, self-organization and emergence, DBS serves as an alternative approach to the optimization of a global objective function in the task of clustering. The swarm omits the usage of a global objective function and is parameter-free because it searches for the Nash equilibrium during its annealing process. To our knowledge, DBS is the first swarm combining these approaches and its clustering can outperform common clustering methods if no prior knowledge about the data is available. A central problem in clustering is the correct estimation of the number of clusters. This is addressed by a DBS visualization called topographic map which allows assessing the number of clusters. It is known that all clustering algorithms construct clusters, no matter if the data set contains clusters or not. In contrast to most other clustering algorithms, the topographic map identifies that clustering of the data is meaningless if the data contains no (natural) clusters.

Stock Picking
In principle, fundamental data of companies may be used to select stocks, which have a high probability of rising or falling stock prices. On the one hand, many of the commonly known rules for such a stock-picking process are too vague to be applied in concrete cases. On the other hand, it is challenging to analyze high-dimensional data with a low number of cases in order to derive data-driven rules. This project will result in an explainable AI (XAI) approach on quarterly available fundamental data of companies traded on the German stock market. In the XAI, distance-based data structures (DDS) are identified which guide decision tree induction. The leafs contain subsets of stocks and provide viable explanations that can be rated by a human. The prediction of the future price trends of specific stocks is made possible using the explanations and a rating. In each quarter, stock picking is based on the understanding of the rules with an high success rate.
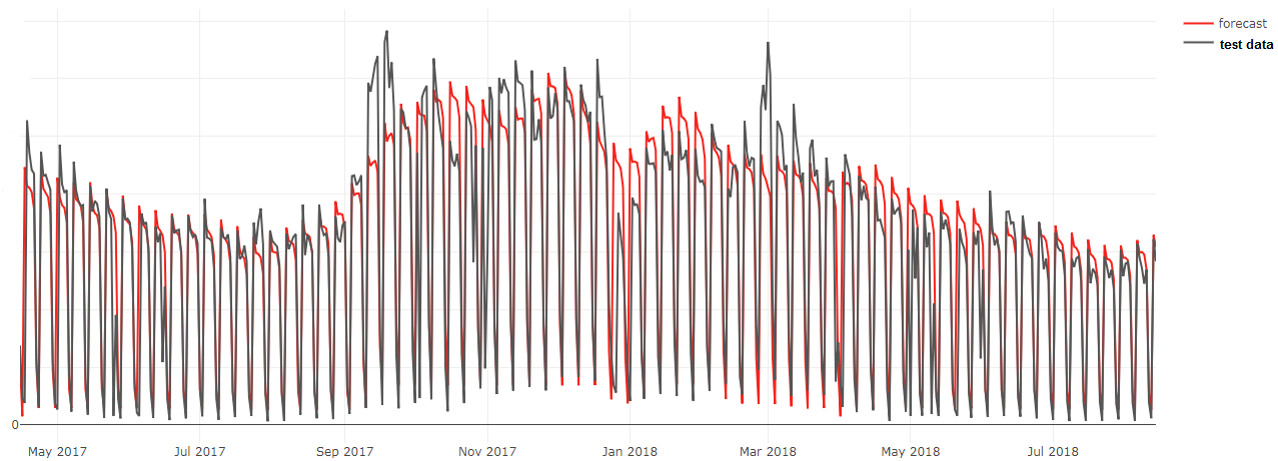
Forecasting for Workforce Management in a Call Center
The forecasting of arriving calls in call centers plays a crucial role in determining appropriate staffing levels and scheduling plans. Usually, the number of calls are forecasted in a period and the best forecasting method is chosen by MAPE/MAE which has two problems. First, the incoming calls are dependent on the background of the call center and customer leading to the comparison of several types of problems which makes any specific choice of one forecasting algorithm impracticable. Thus, we propose to change the data representation of the problem from arriving calls to issues because a low service level can result in multiple calls regarding the same topic. Second, evaluation of forecasting results is always biased if a quality measure (QM) is seen as a similarity measure between the forecast curve and the test set curve of data because any two different curves share the same number of properties. Thus, the QM should be chosen accordingly to the goal, namely, capacity planning with the key performance indicator defined as the service level. A forecast smaller than the real value leads to undesired understaffing. Therefore, a forecast should be more similar, if it lies above the real value. Special events are usually known priorly by the call center manager. Hence less weight should be put on outliers. Capacity planning of the call center using five years of daily historical data and weather data was performed by an ensemble of an additive decomposition model combined with random forest regression. For a forecast horizon of 14 days over a year of test data, the average forecasting quality was 91.3%. For the decomposition model, all parameters were optimized w.r.t. MRE and bias. This Pareto optimization problem was resolved using a radial basis function surrogate that is successively improving around areas of importance using a recursive inversion formula.